


Related News


.png)

.avif)


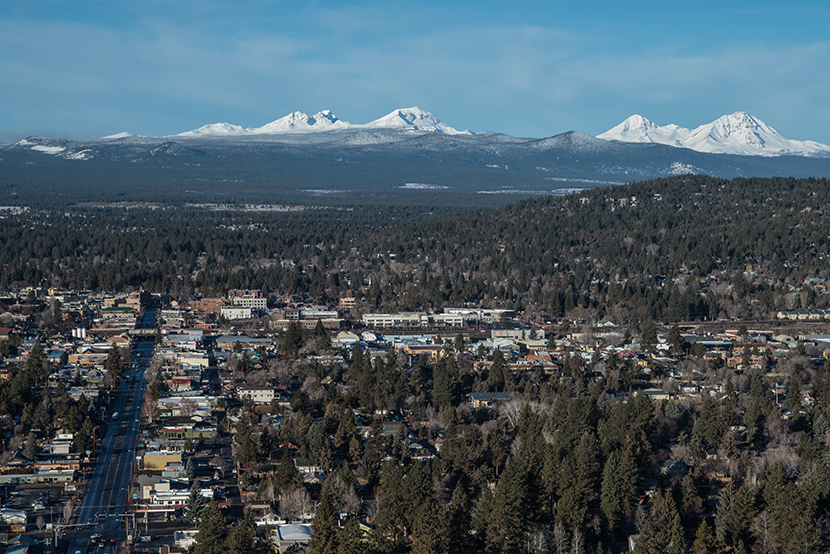
Central Oregon Economy in View:
By Jake Procino | Workforce Analyst/Economist, Multnomah County | Oregon Employment Department
In the East Cascades, there were 4,667 job vacancies with private companies at any given time during the second quarter of 2025. (East Cascades here means Crook, Deschutes, and Jefferson; Hood River, Wasco, Sherman, Gilliam, and Wheeler; and Klamath and Lake counties.) This is about -1,360 fewer job vacancies than the first quarter of 2025, and about -1,888 fewer than the second quarter of 2024. There were about 1.9 unemployed people per job vacancy in the East Cascades in the second quarter of 2025. This ratio is the same as Q1 2025, but higher than at any point from 2022 through 2024. The unemployed per vacancy ratio is a way to measure the relative looseness and tightness of the labor market. When the ratio is higher, it means there is more labor supply compared to demand, and typically businesses have more leverage in the hiring process. When the ratio is lower, it means there is less labor supply compared to demand, and typically laborers have more leverage in the hiring process.
There were 1,218 initial claims for unemployment insurance (UI) made in the East Cascades between September 14 and October 11, 2025 (four weeks). The top three industries with claims were construction (193), health care and social assistance (133) and manufacturing (122). Initial claims are a way to gauge how many, where and in what industries people are losing their jobs. It is not a perfect measure because not everyone who loses their job files a claim for UI. Initial claims for UI reflect first-time claims for regular unemployment benefits. This includes workers in private and public organizations covered by unemployment insurance. Claims filed by former federal workers are generally not included.
Find more about the Central Oregon economy here.
Topic of the Month: Fourth Quarter 2024 Federal Jobs by County
Oregon had an average of 29,000 federal government jobs covered by unemployment benefits during the first two quarters of 2025. That accounted for about 1.5% of total covered employment in the state. Federal government jobs tend to be high paying compared with the annual average wage for all sectors. Federal jobs also tend to account for a larger share of employment in many of Oregon’s rural counties.
Published reports from across Oregon and the U.S. detail workforce reductions occurring in federal government starting early in 2025. As of October 13, 2025, the latest published Current Employment Statistics (CES) report showed a loss of 1,100 federal government jobs in Oregon from August 2024 to August 2025.
While federal government jobs accounted for about 1.5% of all employment, the share was much higher in some areas of the state, particularly in rural counties. In the fourth quarter of 2024, the top 10 counties by share of all jobs in federal government were rural areas. More than 15% of all jobs in Sherman County were in federal government. The next-largest shares were in Grant (9%), Harney (8%), and Lake (8%) counties.
Federal government jobs also tend to pay relatively high wages. Looking at annual average wages, jobs on federal government payrolls in Oregon paid nearly $98,500 in 2024. That was 38% higher than the average annual wage of $71,300 for all jobs in Oregon.
Read more about Federal employment in Oregon on QualityInfo.org here.
Articles of Interest
“September 2025 Labor Market Update: The Squeeze on New Entrants Mirrors a Marketwide Decline,” by Allison Shrivastava, Indeed Hiring Lab.
“Is the Social Safety Net a Long-Term Investment? Large-Scale Evidence from the Food Stamps Program,” by Martha J. Bailey, Hilary W. Hoynes, Maya Rossin-Slater & Reed Walker, National Bureau of Economic Research.
“What is it like to be a rancher at 4,200 feet elevation in Eastern Oregon?” by Lillian Karabaic, Oregon Public Broadcasting.
The articles, research and publications herein are solely for educational purposes and do not imply endorsement nor reflect the views of the Oregon Employment Department.
